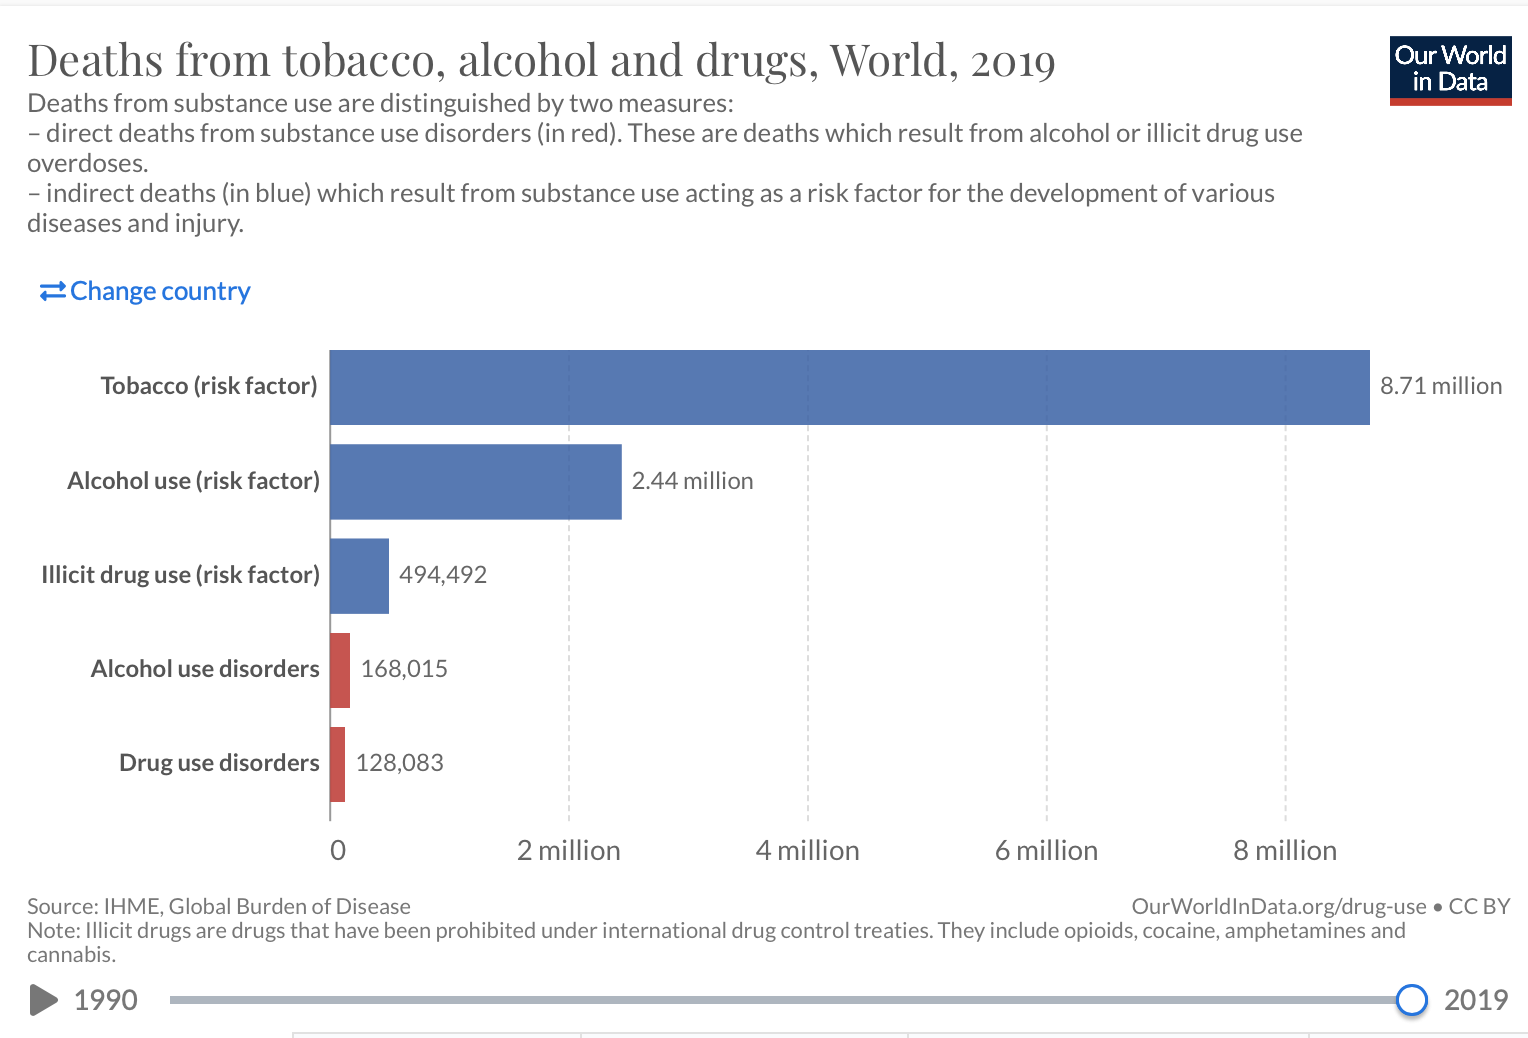
I downloaded deaths by substance abuse from Our world in data. I selected this data because interested in countries with most deaths due to substance abuse from 1900-2019.
This is the [link] (hhttps://ourworldindata.org/grapher/substances-risk-factor-vs-direct-deaths) to the data.
The following code chunk loads the package I will use to read in and prepare the data for analysis.
- Read the data in
- Use glimpse to see the names and types of the column
glimpse(substances_risk_factor_vs_direct_deaths)
Rows: 6,840
Columns: 8
$ Entity                                                                                <chr> …
$ Code                                                                                  <chr> …
$ Year                                                                                  <dbl> …
$ `Deaths - Drug use disorders - Sex: Both - Age: All Ages (Number)`                    <dbl> …
$ `Deaths - Alcohol use disorders - Sex: Both - Age: All Ages (Number)`                 <dbl> …
$ `Deaths - Cause: All causes - Risk: Tobacco - Sex: Both - Age: All Ages (Number)`     <dbl> …
$ `Deaths - Cause: All causes - Risk: Drug use - Sex: Both - Age: All Ages (Number)`    <dbl> …
$ `Deaths - Cause: All causes - Risk: Alcohol use - Sex: Both - Age: All Ages (Number)` <dbl> …
#view(substances_risk_factor_vs_direct_deaths)
- Use output from glimpse (and View) to prepare the data for analysis
Change/renamed the 4th column name to drug use disorders, change the 5th column name to Alcohol use disorder, 6th column to Tobacco, 7th column to Illicit drug use and 8th column alcohol use
Filter the year 2019, Entity = world
Select Drug use disorders, Alcohol use disorders, Tobacco, Illicit drug use, Alcohol use
regional_deaths <- substances_risk_factor_vs_direct_deaths %>%
  rename(Drug_use_disorders = 4, Alcohol_use_disorders = 5, Tobacco = 6, Illicit_drug_use = 7, Alcohol_use = 8) %>%
  filter(Year == 2019, Entity == "World") %>%
  select(Drug_use_disorders, Alcohol_use_disorders, Tobacco, Illicit_drug_use, Alcohol_use)


regional_deaths
# A tibble: 1 × 5
  Drug_use_disorders Alcohol_use_disorders Tobacco Illicit_drug_use
               <dbl>                 <dbl>   <dbl>            <dbl>
1             128083                168015 8708898           494492
# … with 1 more variable: Alcohol_use <dbl>
Check that the total for drug use disorders equals the total in the graph
Add a picture
 Write the data file in the project directory
write_csv(regional_deaths, file = "regional_deaths.csv")